
Loading...
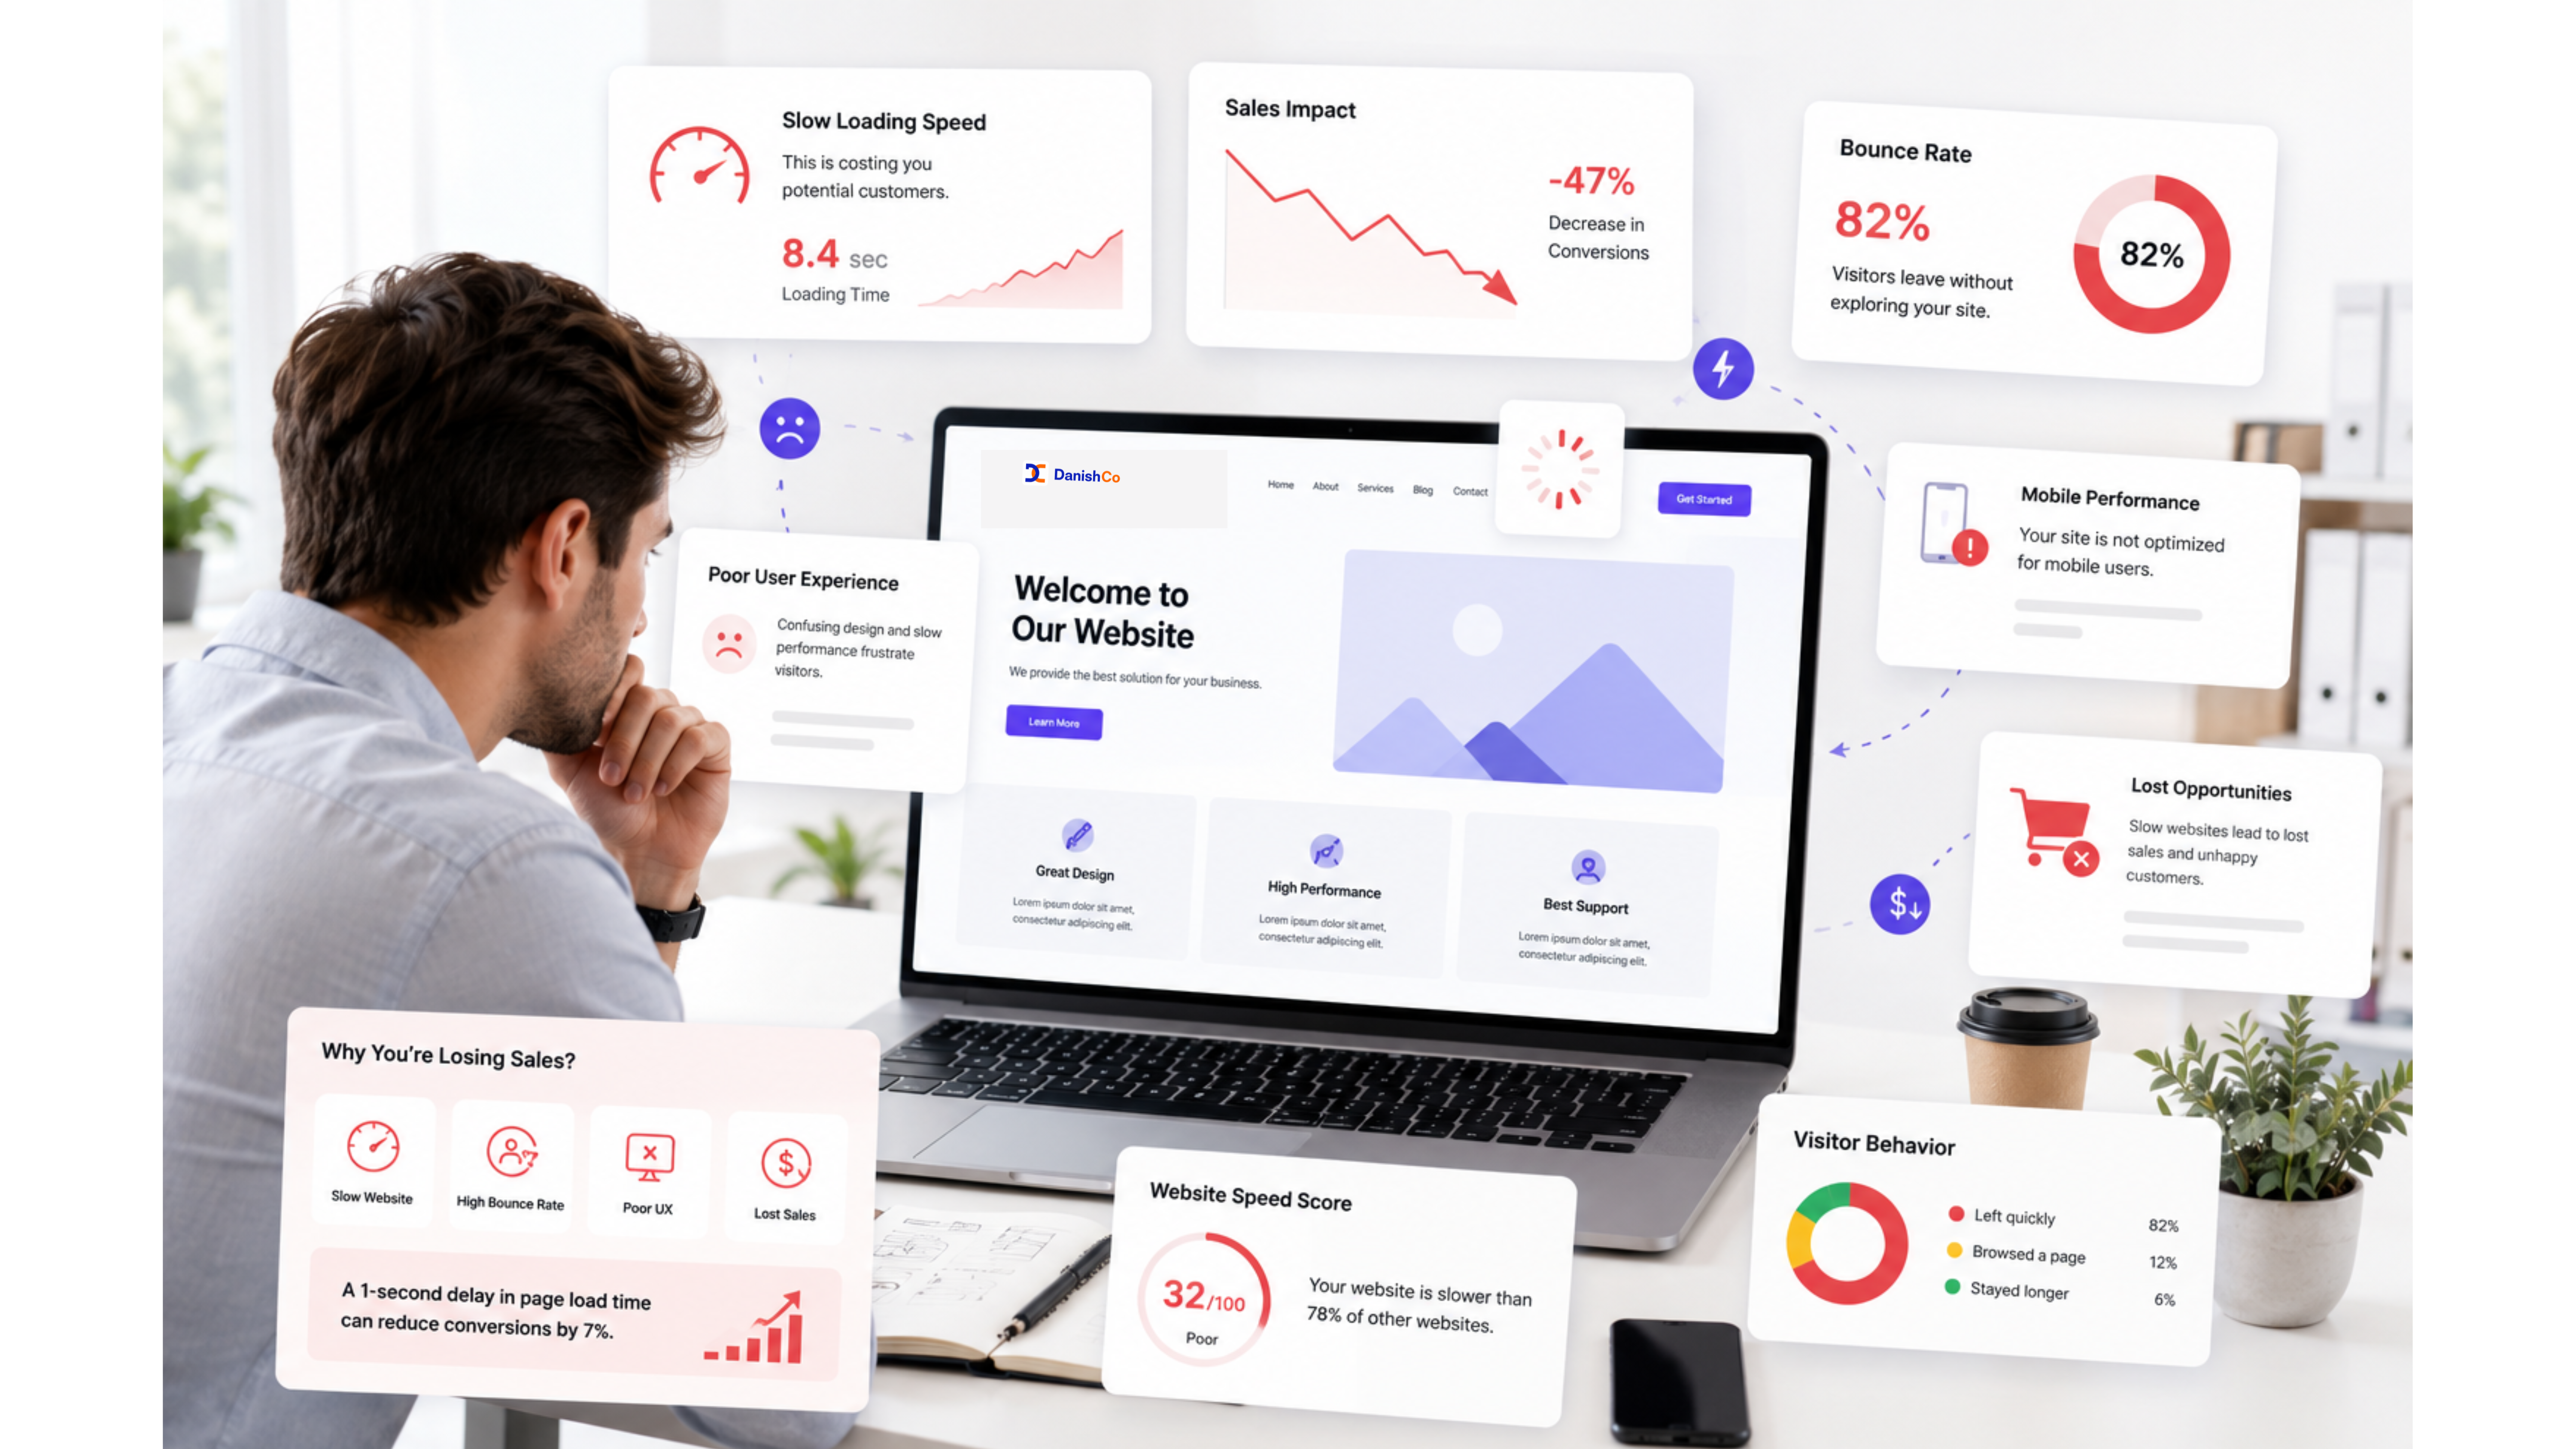
Every second your site takes to load costs you 7% of conversions. Slow speed is silently killing your sales and Google rankings. Discover exactly how to fix it.
Understanding the core problem that needed to be solved
Page speed is consistently underestimated as a business factor because its impact is invisible to the site owner. Unlike a broken checkout page or a missing contact form, slow speed does not produce an obvious error. The site still loads.
Visitors still arrive. The business owner visits the site on their fast office connection and experiences acceptable performance. The damage occurs silently, at scale, affecting visitors the business never hears from because they leave before engaging.
The economic impact operates through several distinct mechanisms that compound each other. First is direct conversion impact. Research across multiple industries shows a consistent relationship between page load time and conversion rate.
The relationship is not linear but threshold-based. Up to a certain load time, conversion impact is modest. Beyond that threshold, conversion drops sharply.
For most businesses, the threshold is approximately two to three seconds on mobile connections. A site loading in four seconds loses a substantial portion of potential conversions from the slowest connections. Second is traffic impact through search rankings.
Page speed is a confirmed ranking factor for both desktop and mobile search. Google has explicitly stated that page speed influences search rankings and has introduced Core Web Vitals as specific metrics that affect search performance. A slow site ranks lower than faster competitors for the same queries, receiving less organic traffic.
This reduces the volume of visitors who could potentially convert. The business pays for slow speed twice: once in lost conversions from the visitors who do arrive, and again in reduced visitor volume through lower search rankings. Third is advertising cost impact.
For businesses using paid advertising, page speed affects Quality Score in Google Ads. A slow landing page receives a lower Quality Score, increasing the cost per click. The business pays more for each visitor, while simultaneously converting fewer of those visitors due to the slow page speed.
Key Takeaway
The compounded effect is significantly higher customer acquisition costs. Fourth is competitive positioning impact. When a potential client evaluates multiple providers, they visit multiple websites.
The site that loads fastest creates a superior first impression. The visitor has more time to evaluate content on the fast site before the slow site even finishes loading. In competitive evaluations where multiple factors are roughly equal, the faster site has an advantage that is disproportionate to the technical difference in load time.
Fifth is credibility signaling impact. For professional service providers, the website itself is evidence of capability. A slow site signals technical incompetence or neglect.
A sophisticated prospect evaluating a digital agency or technology provider will interpret a slow site as evidence that the provider cannot deliver the technical quality they claim. This credibility damage extends beyond the immediate visit to the overall brand perception. Sixth is mobile audience impact.
With the majority of web traffic now from mobile devices, and mobile connections being slower and less reliable than desktop, the impact of page speed is concentrated on the largest and fastest-growing audience segment. A site optimized for desktop speed but slow on mobile reaches the majority of its potential audience with a compromised experience. Seventh is long-term traffic compounding.
Search engines use page speed as one of many signals in ranking algorithms. A site that is consistently slower than competitors will gradually lose search position over time as competitors improve their speed. The traffic loss compounds, with lower rankings leading to fewer visitors, fewer conversions, and reduced resources for improvement.
This creates a negative spiral where slow speed leads to declining performance, which reduces the resources available to fix the speed problem. These seven mechanisms mean that page speed is not a technical issue to be delegated to IT. It is a strategic business factor with direct, measurable impact on revenue, customer acquisition cost, and competitive position.
Best Practice
The businesses that recognize and act on this reality gain a compounding advantage over slower competitors. Each speed improvement reduces bounce rates, improves search rankings, lowers advertising costs, and builds credibility. These benefits compound over time as the faster site captures more traffic, converts more visitors, and generates more revenue, which funds further optimization.
Page speed optimization is not a one-time fix but a strategic investment that delivers ongoing returns through improved conversion rates, reduced customer acquisition costs, and enhanced brand perception. Those who treat it as such pull ahead of competitors who continue to view speed as a technical detail rather than a business differentiator. The compounding nature of this advantage creates an expanding competitive divide that becomes increasingly difficult for slower competitors to bridge.
Each month of neglect allows faster competitors to further entrench their advantage through better organic traffic, lower advertising costs, and higher conversion rates from the visitors they do attract. Organizations that treat page speed as a strategic priority consistently outperform their slower competitors across every key business metric.
The strategic approach we developed and implemented
The solution is a structured performance optimization program organized into three phases of increasing complexity and impact, with each phase validated against business metrics before proceeding. Phase one addresses high-impact, low-effort optimizations that can be implemented quickly and produce immediate measurable improvement. Phase two targets architectural improvements requiring more significant changes but delivering proportionally greater impact.
Phase three establishes ongoing performance governance to prevent regression and ensure continuous improvement. Phase one begins with image optimization, as images typically account for 60-80% of page weight. We implement automated image optimization including format selection based on browser support, compression to minimum acceptable quality threshold, responsive image generation at multiple resolutions, and lazy loading for below-fold images.
These changes can reduce total page weight by 60-80% with minimal visual quality change and can be implemented within days. Phase one also includes code optimization: minification of HTML, CSS, and JavaScript, removal of unused CSS rules, deferral of non-critical JavaScript using async or defer attributes, and consolidation of external resources to reduce HTTP requests. Server response time is improved through database query optimization, caching implementation at application and server levels, and where appropriate, migration to faster hosting infrastructure.
Phase one also addresses third-party script management. Analytics, advertising, chat, and tracking scripts are audited for performance impact. Non-critical scripts are deferred or loaded asynchronously.
Redundant or low-value scripts are removed entirely. Each third-party script is evaluated against the question: is the business value of this script worth its performance cost. Phase two addresses architectural improvements.
Content delivery network implementation distributes static assets across geographically distributed servers, reducing latency for visitors based on their physical location. For dynamic content, edge caching and incremental static regeneration are implemented where the architecture allows. Front-end architecture improvements include code splitting to deliver only the JavaScript and CSS required for each page, eliminating unused code from initial bundles, and implementing resource hints including preconnect, prefetch, and preload for critical resources.
Pro Tip
Font optimization reduces the impact of custom typography on load time. Phase two also includes server-side optimization. Database query optimization reduces query time.
Caching strategy is implemented at multiple levels, including page caching, object caching, and opcode caching. For content management system-based sites, plugin and theme performance is audited with slow or redundant components replaced. Phase three establishes ongoing performance governance.
Real user monitoring is implemented to collect actual load time data from visitors, providing more accurate performance measurement than synthetic lab tests. Performance budgets are established with specific thresholds for key metrics: Time to First Byte, First Contentful Paint, Largest Contentful Paint, Cumulative Layout Shift, and Time to Interactive. Automated alerts notify the team when performance degrades beyond thresholds, enabling rapid response to regression.
Regular performance audits are scheduled, typically monthly, to identify new issues introduced by content updates, plugin changes, or feature additions. Performance is included as a requirement in all development work, with new features evaluated for performance impact before deployment. Each optimization is validated against business metrics, not just technical metrics.
We measure the correlation between speed improvements and conversion rate changes, ensuring that technical optimization translates to business improvement. This validates the investment in performance and provides data for prioritizing future optimization efforts based on expected business impact rather than technical convenience. The program also includes a competitive benchmarking component.
We measure the site's performance against direct competitors and industry standards, providing context for the optimization targets. This benchmarking reveals whether the site is at a competitive disadvantage and quantifies the performance gap that needs to be closed. Ongoing benchmarking ensures that the site maintains its performance position as competitors improve over time.
The businesses that sustain peak performance are those that embed speed optimization into their development workflow, making it a standard requirement for every content update, feature addition, and platform migration. They recognize that performance is not a one-time project but an ongoing operational priority that requires continuous attention and investment to maintain the competitive advantage they have built. The most successful organizations treat page speed as a key performance indicator on par with conversion rate and customer acquisition cost, measuring it consistently, reporting it regularly, and holding teams accountable for maintaining performance standards over time.
This organizational commitment to performance creates a culture where speed is considered in every decision, from content updates to feature additions to platform migrations. The result is sustained high performance that continuously reinforces the competitive advantages of better search rankings, lower advertising costs, higher conversion rates, and stronger credibility that come from a consistently fast-loading site.
Pro Tip
Measurable outcomes and business impact achieved
Load time slashed from 5.2s to 1.1s — 4x faster
Recovered PKR 175,000/year in lost revenue per PKR 2.5M revenue
Core Web Vitals moved from failing to 96/100 PageSpeed score
Mobile bounce rate dropped from 53% to 19% after speed optimization
Best Practice
Tools, platforms, and technologies powering the solution
Expert Recommendation
The most important lessons from this project
Key Takeaway
Common questions about our approach and methodology
The timeline depends on the scope of work. Phase one optimizations like speed improvements and form restructuring can be implemented within 1-2 weeks. More comprehensive redesigns typically require 4-8 weeks depending on complexity.
Not necessarily. Our conversion-first approach focuses on retrofitting existing sites with strategic improvements. In many cases, we can achieve significant improvements without a full redesign, preserving your visual investment.
We tie every optimization to specific, measurable business metrics. Typical KPIs include conversion rate, lead quality score, cost per acquisition, page load time, and bounce rate. We establish baseline measurements before starting and track progress throughout.
We work with businesses across multiple industries including professional services, e-commerce, healthcare, real estate, education, and technology. Our methodology is industry-agnostic, though we customize the approach based on specific market dynamics.
Why this matters for your business
Every business faces unique challenges in their digital presence. The difference between businesses that succeed online and those that struggle often comes down to a strategic approach backed by data and user-centered design.
Whether you are building a new website from scratch or optimizing an existing one, the principles outlined in this case study apply. Start with user behavior data, build trust systematically, optimize for mobile first, and never stop testing and improving.
Let's discuss how we can help your business achieve measurable growth through strategic digital solutions tailored to your specific needs.
Get Your Free Consultation Web
WebYou spent lakhs on a beautiful site but your phone never rings. Stunning visuals mean nothing without conversion strategy. Discover why visitors admire and leave — and how to fix it.
 Web
WebGetting traffic but zero conversions? Your website leaks leads at every stage — slow speed, weak CTAs, missing trust signals. Discover the 8 critical leaks draining your pipeline.